TrueNet - recently appointed the Commerce Commission's second broadband tester, has just released its April ISP benchmarking results.
From TrueNet principal John Butt:
April Broadband Report
In this April report, TrueNet’s latest results of website download times are showing significant changes. We also explain why we use Mb/s for Internet speed while we use time for downloading a Website. Lastly we provide speed results for Chorus copper lines.
Changes since March include:
-
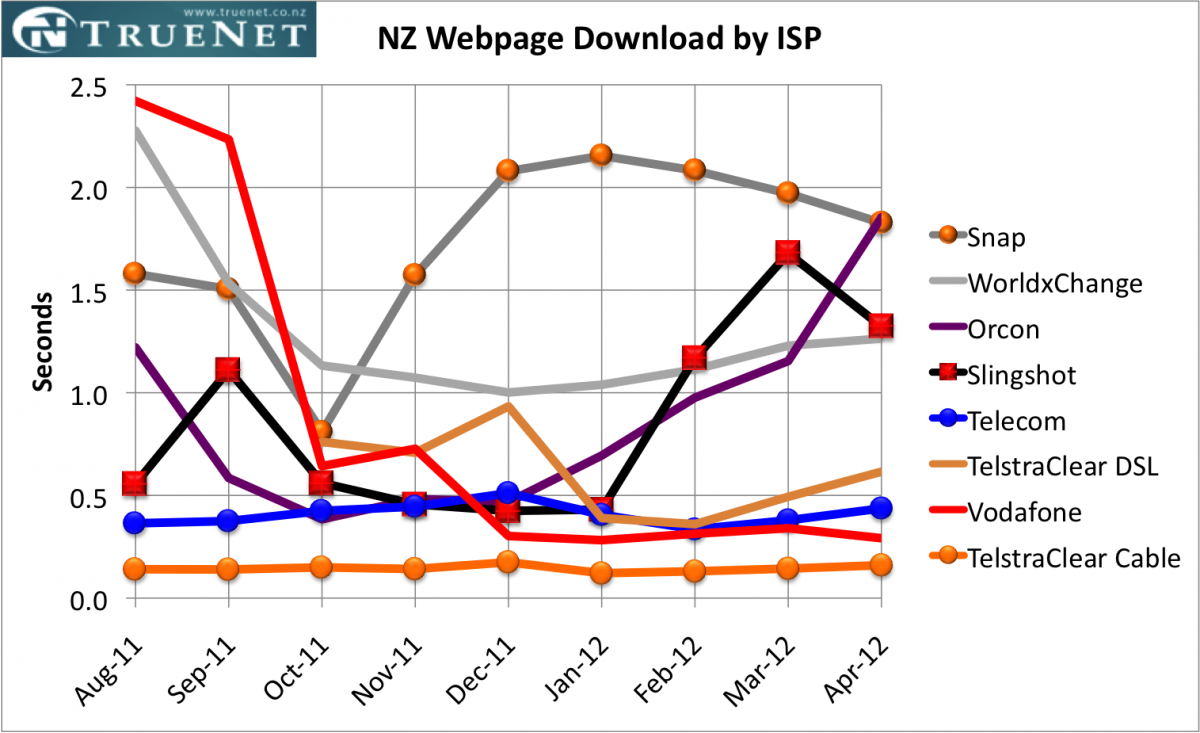
Slingshot has improved their performance from last month in speed tests, and in time to download the webpage.
-
Orcon’s performance has decreased to last equal in the time to download a webpage.
-
Snap while last, is improving in the time it takes to download a webpage.
TrueNet's measurements show that the average copper connection is capable of a speed of 10.9Mb/s. TrueNet's rural probes average speed is half that of the urban probes average speed during off-peak usage hours.
Webpage Download Time (Duration in seconds; lower is better)
Click chart to enlarge
TelstraClear Cable, Vodafone and Telecom, remain top performers for NZ webpage download performance, all managing to stay under 0.5 seconds on average for the last three months.
Slingshot, Orcon and Snap are trailing the rest, but the order has changed significantly with Slingshot and Orcon swapping places. Snap is slowly improving.
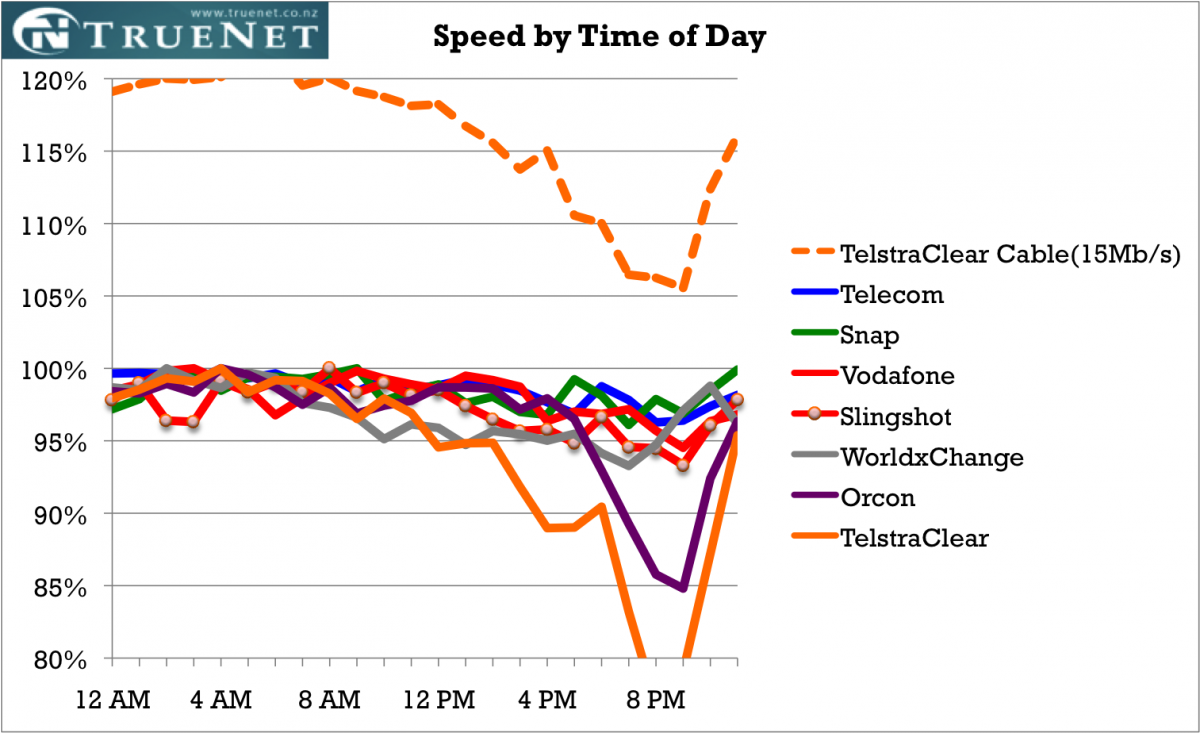
Speed by Time of Day (File Download)
Click chart to enlarge
TrueNet’s Speed tests measure whether each ISP is achieving their advertised speed at all times. Variations in file download speeds (also known as Throughput) are good indicators of the ISPs capacity to deal with peak traffic loads.
The ISPs meeting TrueNet's target of better than 95% of their advertised speed are; TelstraClear Cable, (while their performance drops off, it remains at all times above the advertised speed) Telecom, Snap and Vodafone.
TelstraClear DSL continues to have very slow evening speeds currently dropping below 80% of their best off-peak speeds.
During peak time hours (e.g. 8pm) Orcon continues to show the same pattern as last month dropping to 85% of their maximum speed.
Duration and Speed Explained
This month we explain the difference between the two measurements of performance we use, the time it takes to download TrueNet's standard NZ webpage (we call this Duration) and Speed of a file download.
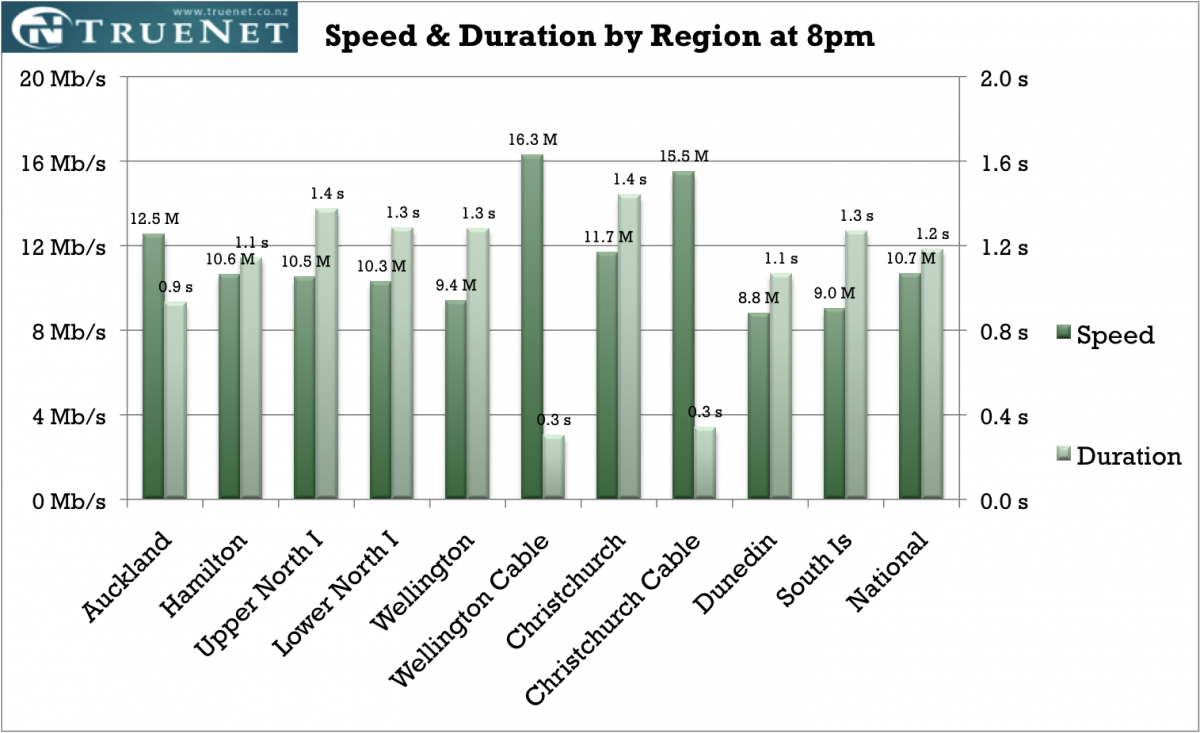
Our “Speed and Duration by ISP at 8pm” chart below is based on average TrueNet measurements in urban centres at 8pm, every night on every probe, for the month of April.
Webpage Download Duration in Seconds (‘s’ below)
TrueNet probes measure the time taken to download TrueNet’s standard NZ webpage which is made up of many files. Using a car journey as an analogy, the time it takes to download a webpage is like the duration of a journey where their are many stops, and a car’s top speed is never reached, e.g. as you would experience along a road with many traffic lights. The speed of each file on the webpage starts slow and accelerates like a car from lights and top speed is unlikely to be reached.
Those ISPs that achieve excellence in webpage download duration, do so through establishing internal networks with best performance in; latency, local storage, and IP address lookup responses. Duration is less likely to be affected by congestion because, like a city street where the traffic lights have the biggest affect on the journey time, ISPs overall performance has a greater affect than speed on duration.
Speed in Megabits per second (M or Mb/s below)
TrueNet probes measure the best speed at which a standard file is able to download; this can be compared to the speed a car is able to travel on an open highway after having accelerated from a stop. Speed measurements throughout a day can identify peak time congestion in an ISPs network - much like a highway with a commuter traffic jam.
Duration & Speed, by Region and Main City
Latency slows performance for Duration measurements, and is expected to increase proportional to distance from the server which is often assumed to be located in Auckland. While some evidence of better DSL Duration performance is shown for Auckland, other centres are almost the same.
The average Speed by location varies for DSL from 8.8Mb/s in Dunedin to 12.5Mb/s in Auckland. Speed on DSL lines (standard Chorus copper lines) is dependent on the length of cable between your connection, and the ISP equipment (DSLAM). Chorus's cabinetisation programme has changed these distances by placing this equipment in roadside cabinets closer to homes. Speed by region is dependent on the mix of TrueNet volunteers probe home-to-cabinet or exchange distances. In Auckland and Christchurch, average probe distances are about 650 meters, while Wellington has a longer average probe distance at 730m, explaining some of the differences in speed. Distance to DSLAM differences are potentially due to the Telecom/Chorus cabinetisation programme, which is now complete.
Cable performance is significantly better than DSL, and is the same for both Wellington and Christchurch. Cable speeds are dependent on local neighbourhood network capacity and not distance.
TrueNet probes do not measure a household or business network's performce, which also impact on the performance observed by consumers.
Note: The chart above measures Speed in Mb/s, and bigger is better. Duration is measured in seconds, and smaller is better.
Rural/Urban Speeds
The average speed of all TrueNet urban DSL probes is 11.6Mb/s. Rural probes make up 10% of all probes and have an average speed of 5.7Mb/s. The average speed overall for TrueNet’s standard copper connections is 10.9Mb/s.
For this sample we use the average speed for each probe at 5am, when there is almost no competition for resources. TrueNet probes measure speed every hour of every day.
Rural & Urban Speed Results
Probe distribution |
Rural |
Urban |
|---|---|---|
|
Less than 5Mb/s |
7% |
5% |
|
5 to 10Mb/s |
2% |
32% |
|
10 to 15Mb/s |
2% |
43% |
|
More than 15Mb/s |
0% |
9% |
Summary
TelstraClear Cable, Telecom and Vodafone are the best overall performers in this month’s measurements. Both maintain speeds well during peak demand, as well as having the quickest download of TrueNet’s standard NZ webpage.
Summary of Speed and Webpage Duration results
|
ISP |
Worst Speed as percentage of Advertised |
Time to download Standard Webpage (Duration) |
|---|---|---|
|
TelstraClear |
77% |
0.6s |
|
Orcon |
85% |
1.9s |
|
WorldxChange |
93% |
1.3s |
|
Slingshot |
93% |
1.3s |
|
Snap |
96% |
1.8s |
|
Vodafone |
95% |
0.3s |
|
Telecom |
96% |
0.4s |
|
TelstraClear Cable(15Mb/s) |
106% |
0.2s |
Note that these measurements are restricted to Files and Webpages, we plan to run further tests to demonstrate the performance by ISP for Video downloads and will be soon publishing Latency statistics by ISP for the Gamers.
We have applied colour to the table to show Green as particularly good, and Orange as noticeably worse than others.
Volunteers
Over the last month TrueNet received many volunteer applications, and we are processing these as quickly as possible. However we need a further 100 volunteers, across all ISPs excluding Telecom. To volunteer click here.
Tue, 15 May 2012


